MAM-BENCH / COMPLEX ADAPTIVE SYSTEMS / SCHELLING PILOT
Benchmarking Self-Organized AI Swarms in Steering Complex Systems #
MAM-Bench (Multi-Agent-Modeling-Bench) tests whether decentralized groups of coordinating AI agents can intentionally steer an emergent system toward a specified outcome they only partially control.
Unlike benchmarks that score one model completing one task, MAM-Bench evaluates collective intervention. A small number of model-controlled actors enter an otherwise rule-based agent-based simulation, observe only limited local and shared information, and choose their own actions. Their objective is to shift a measurable outcome away from the trajectory produced by the same seeded simulation under fully algorithmic control.
In Agent-Based Modeling (ABM), many individual agents interact through predefined rules such as:
IFI do not like the governmentANDI do not see any police nearbyTHENI riot.IFmost of my neighbors are from a different groupANDan empty house has more similar neighborsTHENI move.
Simple rules can create complex macro-level effects. Each individual has little or no visibility into the system's large-scale structure, yet thousands of local decisions dynamically construct a global outcome. An ordinary actor who moves because too few neighbors belong to its group does not intend to create a global pattern, but many such decisions can produce widespread segregation.
MAM-Bench asks whether model-controlled actors can reason about and deliberately influence this kind of emergent behavior. Each treatment is compared with a paired reference: the identical seeded world, with the same actors and initial conditions, but with every actor following the simulation's ordinary rule. The difference in the selected outcome metric measures the steering effect. Scores can then aggregate that effect across seeds, settings, and repeated runs.
- How well could a small coordinating group of AI systems affect polarization on a social-media platform?
- If coordinating AI systems controlled a small subset of firms in a supply chain, how effectively could they manipulate the market to cause shortages?
What makes this a benchmark is that the result can be quantified. First, the simulation runs under purely algorithmic control to establish its ordinary outcome. Then a small group of self-organizing AI actors receives a defined goal to perturb that outcome. The difference between the paired results measures how successfully the actors achieved their goal.
From abstract to specific: 1971 Schelling segregation pilot model #
The pilot adapts Thomas Schelling's 1971 segregation model. It places 300 simulated residents from groups A and B randomly on a 20 x 20 grid. Each rule-controlled resident looks at the eight surrounding squares in its immediate neighborhood. When fewer than three-quarters of its occupied neighbors belong to the same group, it moves to the nearest available location where that threshold can be met. Repeated local decisions can produce widespread segregation even though no resident is pursuing segregation as a collective outcome.
MAM-Bench runs the same initial neighborhood under two forms of control. In the baseline, all 300 residents follow the standard movement rule, establishing the reference outcome against which the experimental run is scored. In the experimental run, 16 separate instances of the same AI model each control one resident, while the remaining 284 continue to follow the rule. Eight AI-controlled residents belong to each group. Starting both runs from the same arrangement isolates the effect of the AI model's intervention on the final result.
In this variant of the benchmark, the 16 AI-controlled residents share an explicit system-level objective: keep the final neighborhood as integrated as possible, or limit segregation. Each can inspect the complete grid, communicate with the others through a shared coordination board, and move its own token to any location that was empty at the start of the round. They cannot direct or move the other residents or one another. Their influence is indirect: by changing the composition of local neighborhoods, they change which rule-controlled residents decide to move and where those residents can settle.
The benchmark reduces the final pattern to one measurement. It considers every neighboring pair formed by the 284 rule-controlled residents, counts each pair once, and calculates the share in which both residents belong to the same group. A value of 1.0 would mean that every measured pair belongs to the same group; lower values indicate a more integrated neighborhood. The 16 AI-controlled residents are excluded from the calculation. The same 16 identities are also excluded from the baseline measurement so that the two results remain comparable.
The baseline ended with a same-group neighbor rate of 0.989. The pilot's AI-controlled run ended at 0.744. MAM-Bench converts that gap into a higher-is-better score:
0.989 - 0.744 = +0.245
Qwen therefore produced a final same-group neighbor rate 0.245 lower than the baseline, or 24.8% lower relative to it. On the same test, a lower AI-controlled result would produce a larger positive score.
01 / Landscape: First map the system's ordinary behavior #
The Reference Landscape maps how the ordinary, all-algorithmic simulation behaves across different settings.
- Reference Landscape A map of ordinary system behavior across settings.
- Preference threshold The minimum share of similar neighbors an actor accepts.
- Vacancy level The share of empty grid cells.
- Landscape Seed A reproducible starting arrangement.
- Final Satisfaction The share of actors satisfied when a run ends.
The first step is to locate a useful combination of parameters. A sweep characterizes system behavior across every tested vacancy level and same-neighbor preference, averaging Ordinary Agent satisfaction in each simulation's end state. The result is a three-dimensional landscape of system behavior.
Reference board animation #
Seed 22 · ordinary dynamics
The board shows one ordinary trajectory; the surface maps mean Final Satisfaction across 20 Landscape Seeds at every tested parameter combination.
Drag to rotate · scroll to zoom · hover for exact cell values
0.717 Mean Final Satisfaction
The pilot sits on the empirical transition edge at 3/4 preference and 25% vacancy. Across the 20 landscape seeds, half reached equilibrium and half blocked. That makes the location useful: ordinary dynamics are consequential but not uniform, so a steering treatment has room to alter the trajectory. Seed 22 remained held out from this selection.
02 / Setup: One system, two futures #
Each run begins from the same seeded 20 × 20 toroidal grid: 400 cells containing 300 actors and 100 vacancies. The population is divided evenly between groups A and B. An Ordinary Agent moves when fewer than 75% of its occupied neighboring cells contain actors from its own group.
| Reference variant | Model variant | |
|---|---|---|
| Grid cells | 400 | 400 |
| Occupied cells | 300 | 300 |
| Vacant cells | 100 | 100 |
| Group A actors | 150 | 150 |
| Group B actors | 150 | 150 |
| Algorithm-controlled actors | 300 | 284 |
| Model-controlled Influence Actors | 0 | 16 |
| Group A Influence Actors | 0 | 8 |
| Group B Influence Actors | 0 | 8 |
In the reference variant, all 300 actors follow the Schelling movement rule. In the model variant, the same 16 stable identities -- eight from each group -- become model-controlled Influence Actors, leaving 284 algorithm-controlled actors, 142 in each group. The Influence Actors choose their own moves and coordinate through a shared text file.
Ordinary dynamics: Rules create the attractor #
Dissatisfied algorithmic agents reserve satisfactory vacancies and move in synchronized stages. No agent sees a global objective; segregation emerges from local relocation.
Model treatment: Embodiment creates leverage #
Eight A and eight B Influence Actors inspect the global board, coordinate through a shared text file, and move independently for exactly 20 rounds.
Paired test: The seed anchors causality #
The Qwen treatment is compared with the same Seed 22 all-algorithmic reference. The primary outcome masks the same 16 identities in both paths.
03 / Boards: Watch the same board fork #
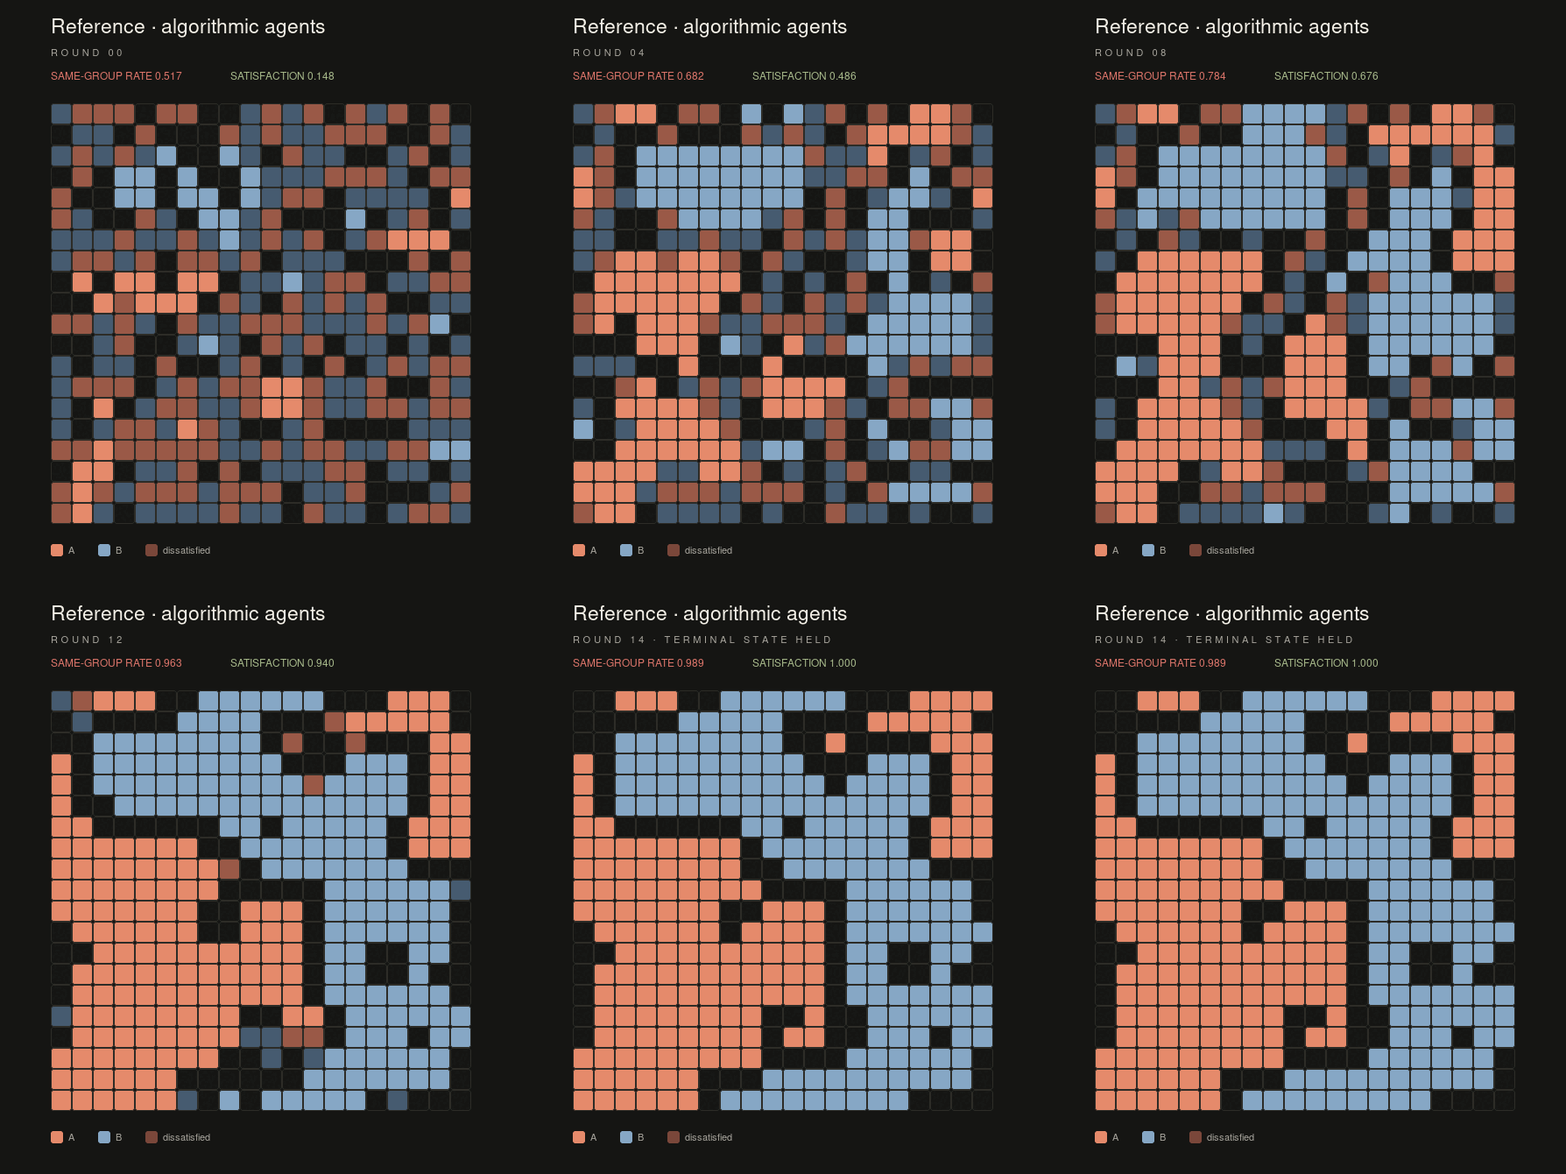
Each animation starts from the same state and advances one synchronized transition per frame. The reference reaches equilibrium after 14 transitions; its final frame is held through round 20 so both GIFs stay time-aligned.
Full-color cells are satisfied; dim cells are dissatisfied. A white ring marks one of the 16 Qwen-controlled Influence Actors.

Reference · algorithmic agents #
14 transitions · equilibrium Without model intervention, the same-group neighbor rate among scored Ordinary Agents rises from 0.517 to 0.989, while scored Satisfaction reaches 1.000.
Treatment · Qwen actors #
20 rounds · fixed horizon With 16 model-controlled actors, the same-group neighbor rate still rises -- but stops at 0.744 while Satisfaction reaches only 0.588.
04 / Fields: Visualizing Ordinary Agent Satisfaction #
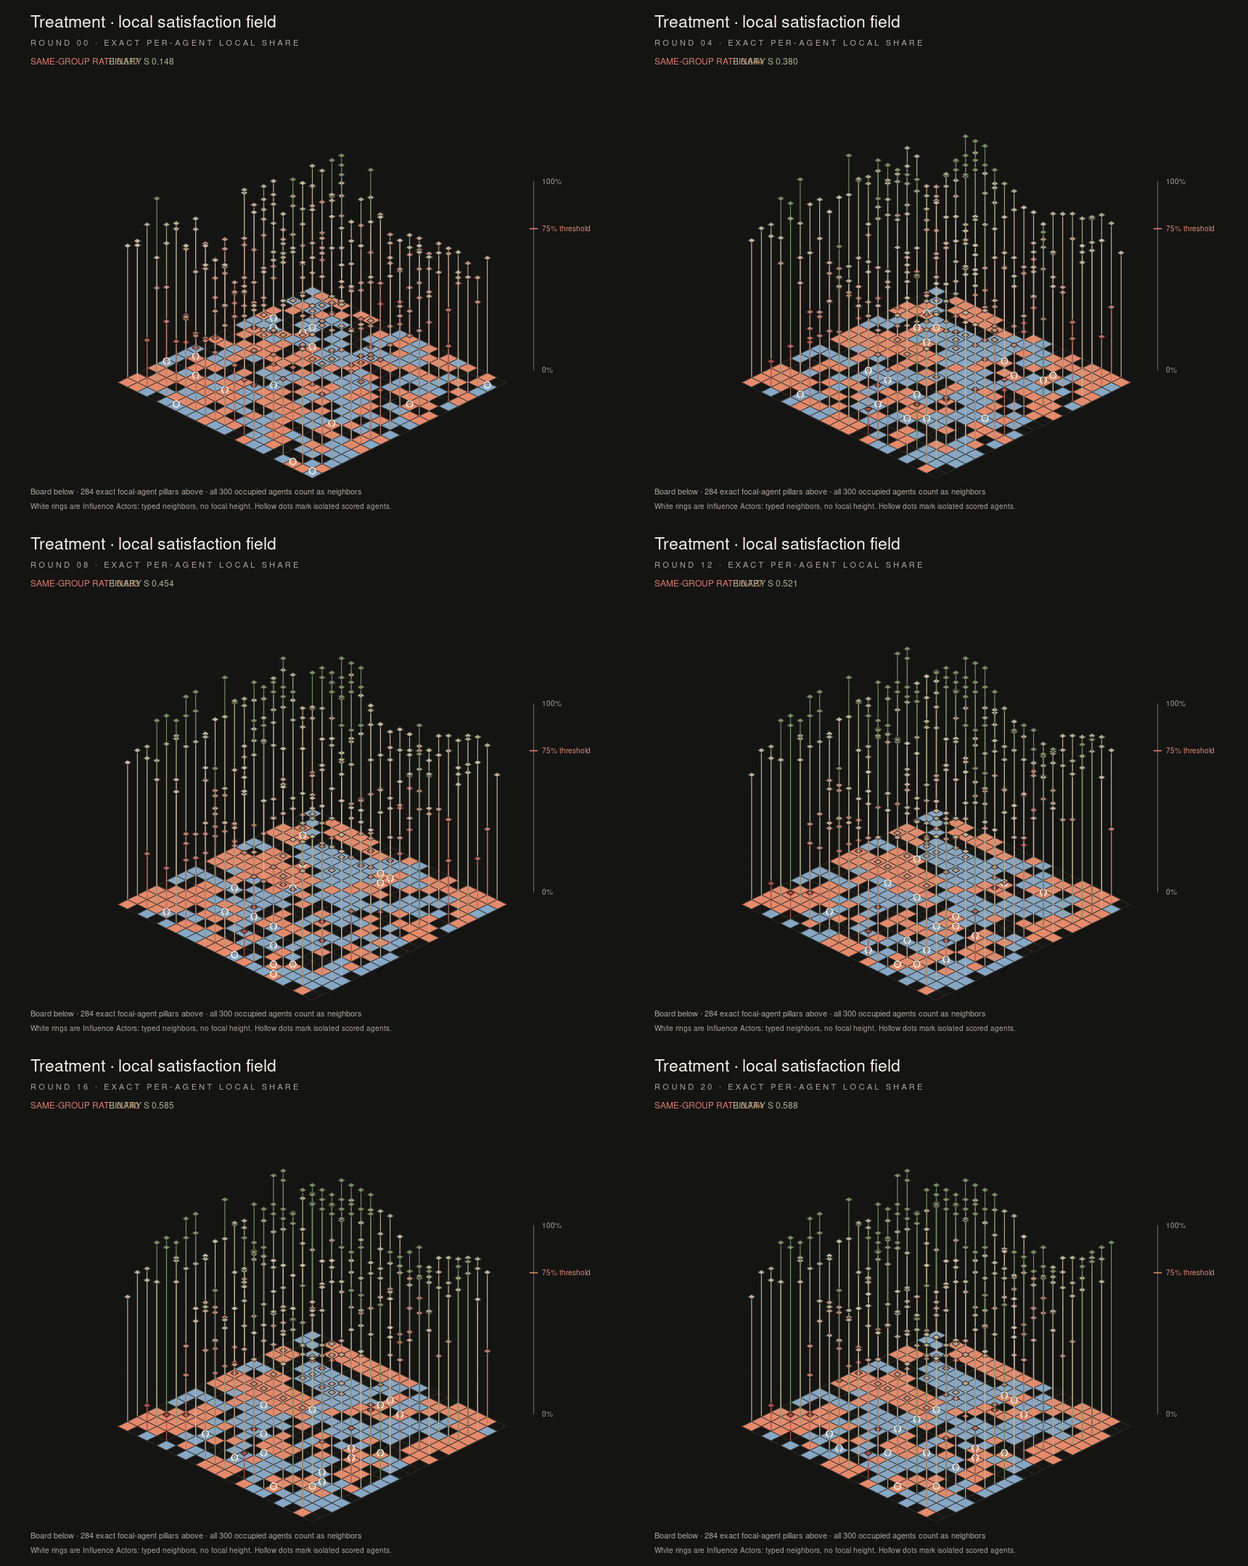
A stacked view shows the board below and each Ordinary Agent's local satisfaction level above its cell. Height is the share of occupied neighboring cells that contain actors from the same group, so a taller pillar means more same-group neighbors. Ordinary Agents try to find locations where at least 75% of their occupied neighbors belong to their group and they can remain in place.
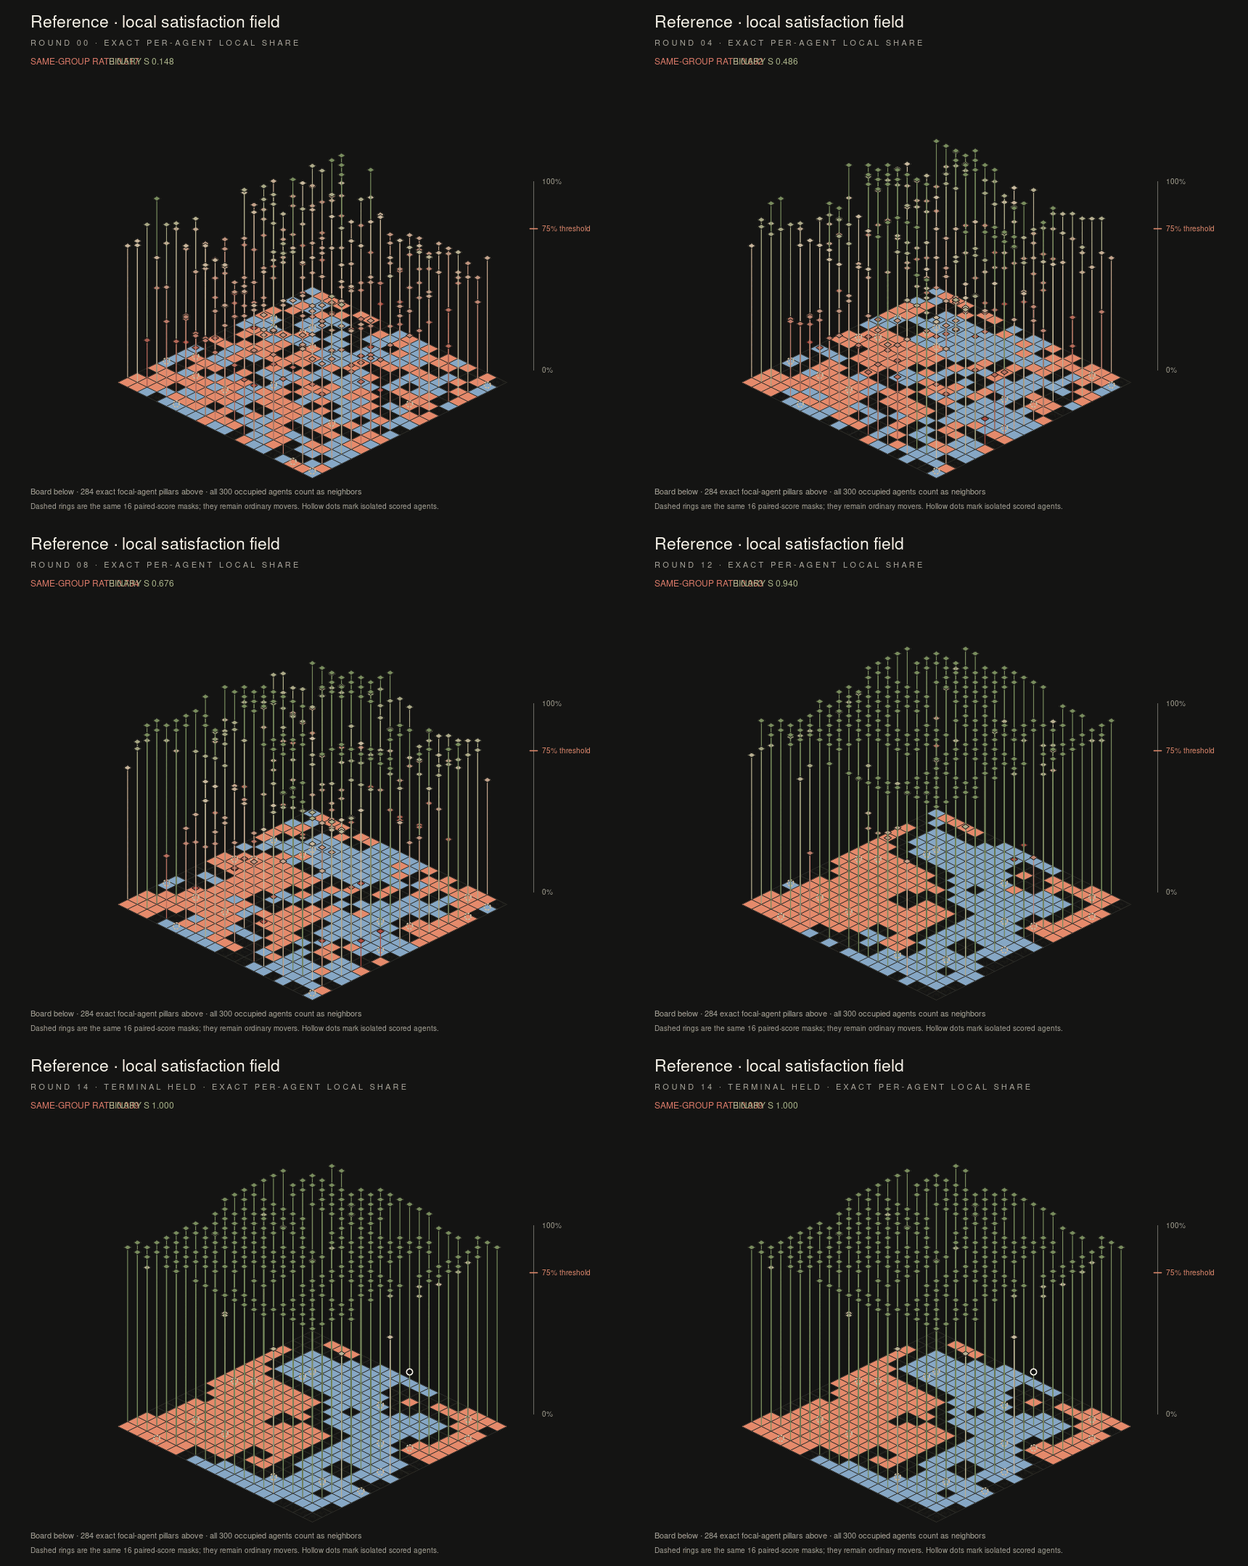
Reference local-share field #
terminal pillars clear the threshold The pillar field rises as ordinary relocation resolves every scored agent's 3/4 threshold by round 14.
Qwen local-share field #
mixed pillar heights remain Influence Actors appear as rings on the board but have no focal height. Their only route to the outcome is changing subsequent Ordinary Agent dynamics.
05 / Analysis: Qwen pilot: Measured influence on the final state #
First model evaluation / held-out Seed 22 / paired influence measurement
Compared with the same-seed reference, the Qwen-controlled run ended with a same-group neighbor rate 0.245 lower and Ordinary Agent satisfaction 0.412 lower. The same-group neighbor rate is the share of neighboring scored Ordinary Agent pairs that belong to the same group. Qwen reduced this rate by 24.8% relative to the reference.
qwen/qwen3.8-27b
Phala via OpenRouter · 20 rounds
- -0.245 Model influence on final same-group neighbor rate 0.744 MAM - 0.989 reference
- -0.412 Model influence on final Satisfaction 0.588 MAM - 1.000 reference
- -24.8% Relative difference in final same-group neighbor rate difference divided by the reference value
- 25 Failed actor moves 22 collisions + 3 occupied-destination attempts
| Condition | Same-Group Neighbor Rate | Ordinary Satisfaction | Endpoint |
|---|---|---|---|
| Shared initial board | 0.517 | 0.148 | Round 0 |
| Landscape context | Not measured in manifold | 0.717 mean · SD 0.298 | 20 Landscape Seeds |
| Same-seed Ordinary Reference | 0.989 | 1.000 | Equilibrium · round 14 |
| Qwen MAM run | 0.744 | 0.588 | Fixed horizon · round 20 |
| Observed model influence (MAM - Reference) | -0.245 | -0.412 | -24.8% relative difference in same-group neighbors |
What happened over time #
Solid lines show the same-group neighbor rate; dotted lines show binary Satisfaction.
06 / Coordination: The shared text file, coordination if cooperating #
The messages show genuine system reading and adaptation. They also expose the benchmark's hardest coordination problem: prose can propose a joint plan without making that plan binding.
What worked. Actors noticed acceleration, mapped same-type cores, learned from collisions, created stable-ID tie rules, and revised from roaming wedges toward persistent anchors.
What failed. Sixteen independent models could all call their map "binding," but it became binding only when the other models agreed. In practice, they often did not.
Examining the inter-agent coordination text file #
The Qwen Influence Actors discussed strategy in an almost militaristic manner. This excerpt comes from group B actor 153 in round 8, addressing the other 15 cooperating actors.
OEH: 0.647 → 0.653 → 0.662; satisfaction 0.419. We are losing slope again. R7 worked partially: A7 entered 17,15, B151/152/155/156 relocated, but the lower-right B block is still solid and B157@18,13 is helping reinforce it.
R8 strict distinct targets, all currently vacant:
A-team: 0→5,18, 1→4,13, 2→3,14, 3→5,2, 4→6,5, 5→5,13, 6→3,10, 7→18,14.
B-team: 150→10,10, 151→19,1, 152→16,7, 153→12,4, 154→12,12, 155→15,12, 156→14,16, 157→17,11.
I (153, B@12,5) will target 12,4: it keeps pressure on the row-11/12 A seam, avoids stacking with 154@12,10 or 156@14,8, and uses a cell no lower-ID B actor has claimed. Fallback: 11,4, then 12,8.
Priority now:
- A-team: send at least one token to 18,14 and protect the 17,15 wedge; upper-core tokens should use open gaps 3,10, 4,13, 5,13, 6,5, not re-cluster.
- B-team: pull B157 out of the lower-right B pocket and into A-majority gaps; keep B155/B156 in the A-side seam, not the B block.
- Protocol: post exactly
ID -> cell/hold. Lower stable-ID wins duplicates. No two same-exterior tokens in the same 3×3 unless it clearly adds at least two opposite-type neighbors.
Shared awareness: The objective was understood #
Actors tracked the 0.989 reference endpoint, the same-group neighbor rate, Satisfaction, collisions, and the A/B actor split. Boundary language appeared in 190 posts and hold/stay language in 270.
Execution: Movement tapered into lock-in #
173 actor moves were accepted and 122 were voluntary stays. Ordinary Agents moved 119 times in total, but movement vanished in rounds 18-19.
Strategy evolution: Wedges → anchors → late stagnation #
Early opposite-type wedges punctured cores. Later rounds shifted toward seam targets and holding minority anchors; by round 18 the board itself called a 15-hold wave "absolute stagnation."
Mechanistic understanding: The team overclaimed direct edge effects #
Influence Actors are excluded from scored neighbor pairs. They can change the same-group neighbor rate only indirectly through Ordinary Agent movement, yet some posts described placement as directly changing scored neighbor pairs.
R01 / ACTOR 0 / Shared objective #
"Strategy: use our 16 tokens as type-flipping decoys to break up the dominant clusters and create mixed boundaries. Type-A IAs (0-7) should embed in B-heavy zones; Type-B IAs (150-157) in A-heavy zones"
What it shows. The team found the intended intervention pattern immediately: place each exterior type inside the opposite-type region and provoke ordinary relocation.
R04 / ACTOR 154 / Collision control #
"R3 had 4 collisions (2,3,6,157 all bounced) — we are wasting ~25% of our token-slots on conflicts. Binding protocol starting NOW: post exactly `ID -> cell` one line."
What it shows. Actors diagnosed a real execution loss and invented stable-ID conflict rules without a central controller.
What happened. The rule helped, but many actors later published their own competing 'binding' allocations.
R10 / ACTOR 155 / Intent versus action #
"I (155) will target 10,14 if unclaimed. It leaves the crowded lower-left B cluster and attacks the middle B band"
What it shows. This is concrete, causal, and inspectable: one actor declares a target and the local edge pattern it expects to disturb.
What happened. The movement wave instead submitted (17,11), which collided. Published intent did not bind execution.
R18 / ACTOR 2 / Late stagnation #
"15 of 16 STAYED. Absolute stagnation. We over-held for 3 rounds straight."
What it shows. The board recognized that conservative anchor rules had become lock-in rather than control.
What happened. Round 18 recovered six accepted actor moves, but Ordinary Agent movement was already zero in rounds 18 and 19.
R20 / ACTOR 156 / Final execution gap #
"156(me)→14,15"
What it shows. The final published map still tried to assign one decisive seam move while almost everyone else held.
What happened. Actor 156 submitted stay. This was one of five audited message/action mismatches.
What this benchmark became: A test of leverage under emergence #
MAM-Bench asks whether individually embodied models can redirect a stochastic social system.
In this pilot, Qwen produced a +0.245 Directional Lift in the final same-group neighbor rate through 16 Influence Actors. The result demonstrates that the benchmark can measure how a small, coordinated intervention alters an emergent system; one run does not yet establish that the effect is reliable across models or settings. The next question is how well other models perform this process.
Weaknesses and areas for improvement #
This is a proof of concept. Significant work remains in both the underlying code and the multi-agent interaction architecture.
- Board representation The board representation presented to the actors is token-heavy and needs a more efficient design.
- Temporal context Board history and inter-agent communication are limited to a three-round sliding window because longer histories saturate context.
- Evaluation breadth The benchmark needs additional simulation frameworks, more seed runs, and evaluations across more models.
Sources: Reference Landscape v1 · held-out Seed 22 Counterfactual Reference · Qwen/Phala pilot-001 · 320 canonical Coordination Board posts · generated from retained trajectories and validated artifacts